
The elements uploaded on the material list page are automatically optimized onto the selected board according to our settings.
- At the top of the left sidebar, you can set the optimization parameters and start the process.
- Below that, the statistical data of the created cutting plan can be read.
- Next to it, a cutting plan of a board is displayed. There is no limit to the number of boards and sheets that can be cut.
Handling remnants and waste
- The program handles remnants and waste separately (light and dark gray). The point at which a sheet is considered a remnant can be set on the settings page.
- The remnant sheets can be automatically used in the next optimization.
- The number of boards in the information includes in parentheses how many remnants were used.
Handling rotations
- The number of a rotatable sheet appears on a yellow background.
- If such a sheet actually rotates after optimization, the program indicates it with a red frame. The rotation is also marked with an F in parentheses after its dimensions.
- The letters indicating edge banding, aAbB, also swap, with the B's appearing first.
- The program automatically writes the dimensions vertically for narrow, tall elements, but this can be modified in the selected sheet data. In vertical writing, only the dimensions appear.
- A dimension list with identifier numbers appears on the right side of the sheet.
Optimization methods
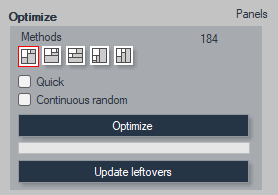
- The top five icons allow us to choose the cutting styles.
- The first one is free cutting. In this case, the program tries all available variations.
- The second one primarily cuts in the grain direction, arranging the elements into completely cut strips, but it can use the remaining spaces for new strips.
- The third one, strict strip cutting in the grain direction, does not allow breaking the remnants. In this case, each different cross-grain size is placed in a separate strip. It is not economical, but very little rotation of the sheets is required during cutting. It might be worth it for larger quantities.
-
The fourth and fifth are the same as the previous two, but in the cross-grain direction.
- The first one is free cutting. In this case, the program tries all available variations.
Optimization process
- After pressing the optimize button, the cutting map is drawn.
- The program tries many variations for each method and selects the most optimal layout. It monitors the top 3 statistical values.
- Minimize the number of boards used.
- Maximize usable remnants.
- Minimize cutting length.
- Minimize the number of boards used.
- By turning on the quick switch, the machine skips the time-consuming methods.
- The quick switch skips time-consuming methods. Over 300 cut elements automatically activate this to avoid long waiting times. This can be turned off, but it may take longer, yielding better results.
- The quick switch skips time-consuming methods. Over 300 cut elements automatically activate this to avoid long waiting times. This can be turned off, but it may take longer, yielding better results.
Interrupting optimization
- The process can be interrupted at any time by pressing the space key. The process may not stop immediately; hold the key until it stops. The best method so far will be the result.
Continuous random optimization
- When using the continuous random switch, the program works differently. It randomly changes the parameters for different methods, potentially yielding better results. The search continuously runs, and the best result is displayed in the three yellow fields.
-
To stop the process, hold down the space key!
Updating remnants
After optimization, the update remnants button deletes used remnants and adds new ones to the list.
Statistics
- Separate statistics are displayed for the overall, current board, and selected sheet data.
- The cost calculation is completely independent of the manufacturing preparation cost calculation, using only the values entered for boards and cutting properties.
- Sheets can be selected with the mouse. When selected, they turn blue on the drawing, and their name and dimensions appear under the selected sheet data. Rotatability and vertical writing of dimensions can also be set per sheet.
Board data
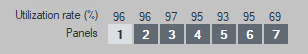
- The buttons above the cutting map allow you to choose among the boards if the layout spans multiple boards.
- Above the buttons, the utilization percentage of the given board is displayed.
- For over 20 boards, the buttons appear in blocks of 20.
Cutting positions
-
The top row icon shows the absolute positions of the cuts next to and below the board.
Printing
-
Pressing the icon prints all board drawings, headers, and the list on separate pages according to the settings page. The monitor display of the drawing and texts serves as a print preview, but the print will be black and white, and gray remnants and waste can be turned off (for ink-saving reasons). It can be set to avoid printing identical boards multiple times.
-
Label printing is available. Each cut sheet's data is printed on separate labels. Label size and format can be set on the settings page. The fields next to the icon specify the starting position for printing on the first page (for continuing on partially used paper).
- The
icon opens the optimization settings.
Keywords: #optimization #remnants #board data #statistics
Related to
Comments
0 comments
Please sign in to leave a comment.